The profiling, troubleshooting, and debugging tools native to Wwise are one of its many great strengths; they contribute to making this software one of the most complete and powerful game audio middleware. Knowing how to make the most of these features is important to fully appreciate their quality.
This article provides some insight on how to efficiently use the Profiler and Game Object Profiler Layouts, the Schematic View, as well as a few other quick tools you can put to your advantage when troubleshooting and debugging your game’s audio system.
The Profiler Layout

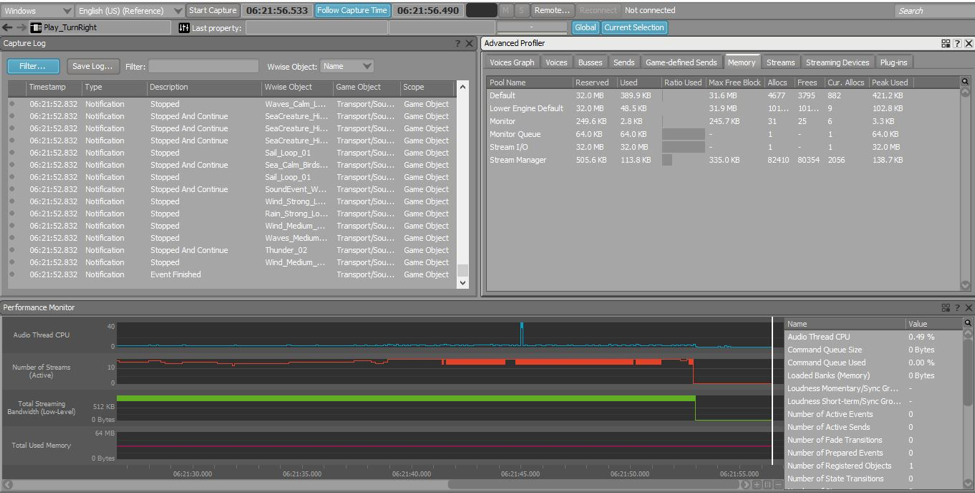
The most obvious profiling tool will certainly be the Profiler Layout. It consists of three views: the Capture Log, the Performance Monitor, and the Advanced Profiler. Its function is to monitor and record performance, memory usage, and all activities coming from the sound engine.
By using the Soundcaster Session, it is possible to profile locally before even implementing the sounds into the game. This allows the sound designer to not have to rely on a working build of the game to profile and debug the audio system; it’s also useful when needing to demonstrate to the developers that audio stays within its allocated memory budget and won’t break the game when implemented. Once audio is in, you can also profile in real time while playing the game. This becomes very handy when you want to make sure that the audio Events are correctly being fired from the game engine, as opposed to triggering them manually in the Soundcaster.
Its top left view, the Capture Log, records all activities coming from the Sound Engine. This will generate a lot of information, so I strongly suggest using the Capture Log Filter to select the components of interest such as Events, Actions, States, and Switches, depending on your needs.
Tip: I have used the Capture Log many times not for debugging purposes, but to help design with precision. For instance, when I know that an audio event is being triggered at the start of an in-game animation, I will remotely connect to the game using Wwise, play and trigger this animation, and record the precise timing of the start and end of animation in the Capture Log. I video capture the whole process so that I can work with that video when designing in my DAW, and clearly see when I should start this animation sound in relation to the game’s timings.
The Performance Monitor view shows information about the performance in terms of CPU, streaming, and memory usage. Once a capture has started, it displays the data in real time, for each activity performed by the sound engine. It is extremely useful to identify peaks in the performance, and to what activity these peaks are related.
Tip: By setting minimum and maximum values in the Performance Monitor Settings, any value exceeding the set maximum will be displayed as a solid block in the graph. This makes it extremely easy to quickly spot where the audio would exceed its maximum allocated budget for whatever value is displayed, such as number of voices, CPU, or memory usage. You can then expand the min and max range for a particular graph to get more details on those problematic areas.
Tip: Drag the Performance Monitor Time Cursor to precisely observe changes in the counter values displayed at the bottom right corner.
In the Advanced Profiler view, you can find very detailed information concerning what is captured in the Log and in the Performance Monitor. It is very handy to refer to it once you have located an issue and wish to understand exactly what the problem is. In game development, you probably have a carefully calculated budget allocated for audio in terms of space, performance, and memory usage. It is of vital importance to respect those numbers, and the Advanced Profiler will allow you to make sure that you do, giving you precise, real time information about the number of voices playing, active busses, memory usage, streaming, and more. Also, the Voices Graph tab shows a real time version of the Schematic View, which makes it easy to spot errors in hierarchies or mistakes in some Game Objects’ settings.
Tip: When working with Asset Bundling, it is very useful to know which SoundBanks are being loaded, as each SoundBank will probably refer to one Asset Bundle. SoundBanks not being loaded at the correct time can indicate issues with the Asset Bundles.
Tip: In order to get more accurate profiling data, use the Profiler Settings dialogue box to filter the information that is captured. This will improve Wwise’s Profiler Performance and save CPU time both in game and in Wwise.
Tip: You can save a profiling session as a file in order to review it later, or to share it with a developer so that it can be analyzed.
The Game Object Profiler Layout

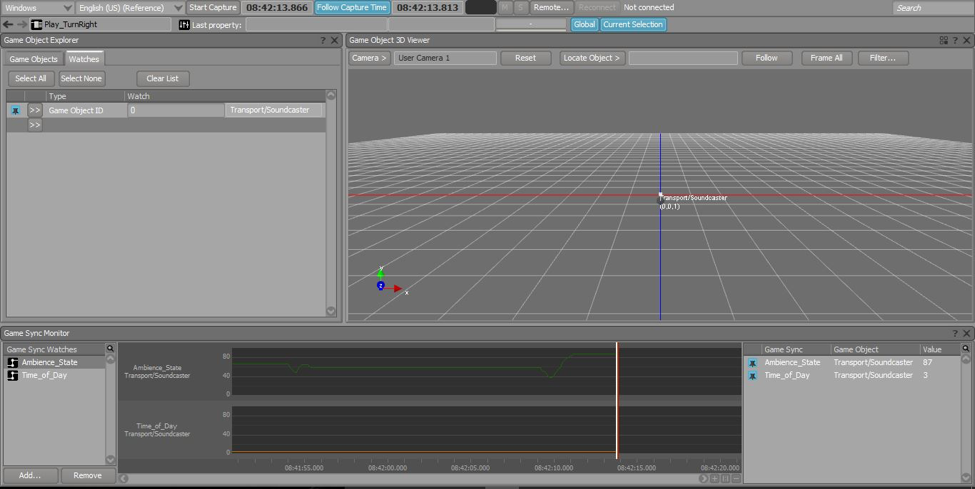
The Game Object Profiler Layout is a less straightforward one to use, but can also be very useful in analyzing real-time information about Game Objects and Listeners in-game. It consists of three views: the Game Object Explorer, the Game Sync Monitor, and the Game Object 3D Viewer. It is meant to be used once the audio is implemented in the game, while connected and playing in real time.
Just like the Profiler Layout, it analyzes the output of the sound engine, but from the point of view of each individual game object instead of the sound engine itself and its various activities. Using the Game Object Profiler Layout, you should be able to account for any sounding game object in the game and make sure it behaves as it is meant to.
I find that what it does best is:
- Visualize the attenuation radius for each object and how it interacts with other objects;
- Test 3D sound settings for moving objects and how they interact with other objects;
- Monitor and analyze RTPC values changing in real time and how it affects the overall soundscape;
- Identify all Game Objects and Listeners, making sure that every element supposed to be there actually is.
In other words, while the Profiler Layout is about performance, I find that the Game Object Profiler Layout is about the game’s audio mechanisms and making sure everything is behaving the way it was set in the engine. It provides a way of overseeing the game’s complete soundscape in action, while debugging not only by ear, but also by relying on actual real time data.
The Game Object Explorer view lists all the sounding Game Objects, as registered by the programmer. You can choose which objects you wish to watch by right-clicking on any of the listed objects. These watched objects will then appear in the Game Object 3D Viewer, where you can observe them as they would behave in-game. The Game Sync Monitor graphically displays any RTPC currently active and their real-time values. These three views combined together make it extremely easy to understand exactly what values result in a sound that is not to your liking, or if RTPCs or other 3D sound settings are not acting as they should or how you would want them to.
The Schematic View

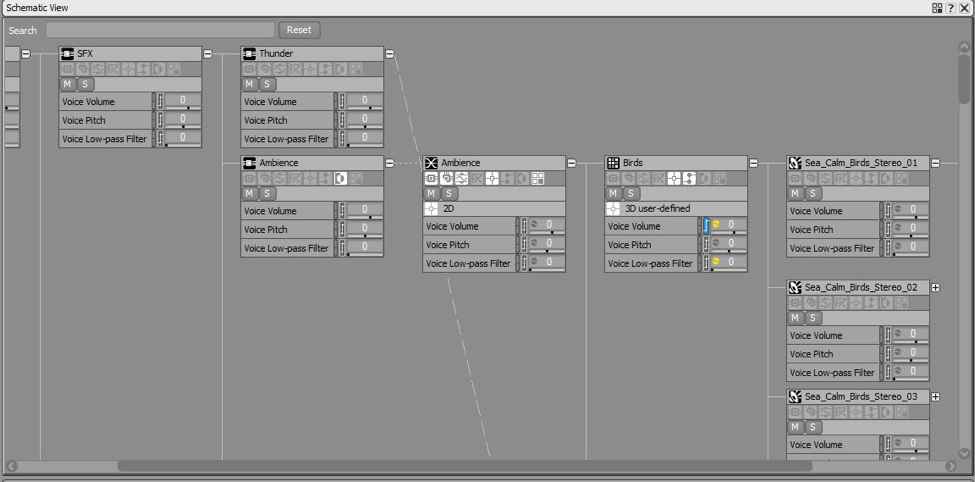
The Schematic View’s primary purpose is not a debugging one, yet it is very handy to review the complex hierarchies contained in the project and make sure the appropriate paths are being triggered according to the correct conditions and settings.
It features a very straightforward workflow, where dragging any component from the Project Explorer into the Schematic View will display its graphical representation, and clicking on the ‘+’ icon expands the hierarchy to the next level.
Where it actually becomes an incredibly handy tool is by allowing you to play any object directly from the Schematic View, making it not only a detailed graphical representation of your game’s audio content, but also a sort of interactive editor and mixer at the same time:
- By double-clicking on any object present in the Schematic View, you can access its properties, without having to switch to the Designer Layout. Similarly, by double-clicking on any sound file at the end of the hierarchy, you can access the Source Editor window and perform basic edits to the file directly from there. A series of right-click options also comes in very handy, such as Find in Project Explorer, which can considerably improve your workflow speed.
- By customizing the Schematic View Settings, you can show properties for each object and, while playing, adjust its settings such as volume, pitch, filters, mute/solo, and more. By activating a few of these properties at once, you can easily transform the Schematic View in a fairly complete mixer. For instance, I like to have access to the volume, the Icon Strips, Mute/Solo, and 3D positioning to have quick and accessible control over every object’s properties while monitoring its position within the audio pipeline.
Tip: Use the Schematic View Search box to quickly locate objects, or use the General Search box (if not already in the Schematic View) to find any object and open it directly in the Schematic View.
Finally, when a project reaches a certain scale, it can become hard to keep track of all the components and objects within your hierarchy, especially if you’ve been playing with multiple versions of sounds and Events. The Event Viewer is very useful to see if a selected object is referenced in any event. I suggest going through your hierarchy every once in a while and make sure you don’t have objects you don’t need, which could be mistakenly loaded in a Soundbank, taking up space you could use for more valuable assets. Similarly, don’t underestimate the Queries tab and the Query Editor, which allow you to locate any Object Type within the project, for instance which busses use Plugins or Effects.
It would also be a mistake not to mention the Soundcaster Session, for it is in itself a testing and debugging tool where you can basically replicate your entire game or sections of your game, focusing on its audio content. The Shift+S shortcut (to show the Soundcaster) should definitely be among the first ones you learn, as this tool is what allows you to listen to your various audio components interacting with each other, and to make sure your States, Switches, RTPCs, and Music Triggers are associated with the correct Events.
Happy debugging :)

.jpg)
Comments